OpenPathology: Issues with reference ranges — Part 1
- Authors:
-
Posted:
- Categories:
This article is part of a series: OpenPathology: Issues with reference ranges
- OpenPathology: Issues with reference ranges — Part 1
- OpenPathology: Issues with reference ranges — Part 2
- OpenPathology: Issues with reference ranges — Part 3
As the OpenPathology project has progressed, we have started to build measures to describe variation between practices, and groups of practices.
While comparing rates of requests per head of population can be used as a simple measure of possible over- or under-use of tests compared to other practices, it doesn’t take into account the general health needs of the population, so it can be difficult to rule out warranted variation. Therefore, comparing variation in rates of abnormal results is another useful measure to consider.
What is an abnormal result?
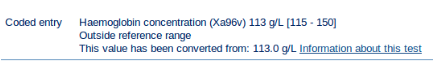
To decide if a result is abnormal, results are typically compared to a reference range when reported back to a GP. For example, a result of 113 g/L of haemoglobin may be below the “lower limit of normal”, and indicates a person may be slightly anaemic. Here is how that might be communicated in your GP practice’s Electronic Health Record:
Of course, a GP will exercise clinical judgement in deciding what to do here. This example is only just abnormal, and the GP would probably advise you not to worry about it.
Nonetheless, for a patient, the impact of being told a result is abnormal can be profound, so it’s important that patients and clinicians understand the inherent limitations of lab methods.
What are the problems?
The limitations include sources of error and uncertainty in the measurements themselves, and unknowns relating to reference ranges. Aside from making it very hard to judge the significance of results, these issues make it even harder to draw conclusions about results from different labs.
We’ll discuss these issues in detail in this series of blogs:
- Part 1 — Uncertainty (this blog): The uncertainty of any test result can be large, and varies between laboratories and types of test;
- Part 2 — Defining reference ranges: (a)The most common basis for reference ranges is a statistical definition based on a healthy population, telling you nothing about disease; and (b) Reference ranges are unlikely to be adequately sensitive in most cases.
- Part 3 — Variation in reference ranges: Reference ranges themselves can vary between labs for unclear reasons.
Uncertainty in test results
A patient who finds the following test result in their online health record might reasonably assume their haemoglobin levels are clinically low, at 113g/L:
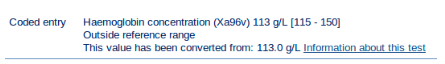
However, it would be more accurate to say “we are 95% confident that the concentration of haemoglobin in your blood is in the range 107.8 — 118.2” (depending on the lab where the test was carried out).
There are several factors that contribute to making this figure uncertain, such as:
-
For any test, every healthy person has a natural “setting point” around which their levels fluctuate. This is not only for tests that are affected by cyclical rhythms like sex hormones, but also for more stable tests. For example, studies show that cholesterol can vary by 6% day-to-day within a healthy patient. This is called “within-subject” variation.
-
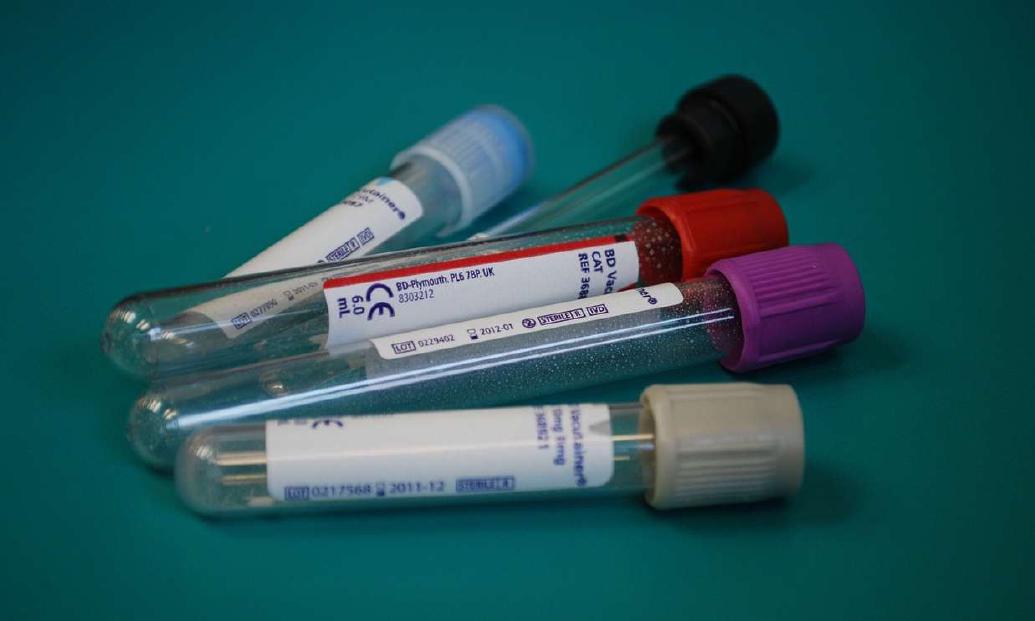
Next, there’s preanalytical variation, which includes variation resulting from inconsistent storing of specimens (something we explored in a blog post about potassium), and postanalytical variation from errors in copying or transferring results.
-
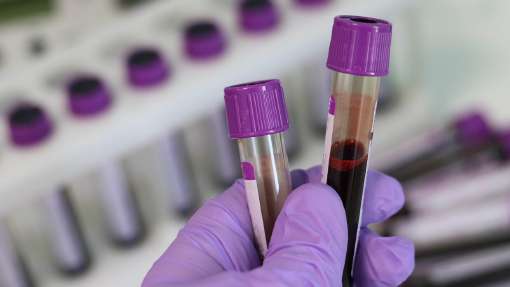
The final source of error arises in the laboratory. Analytical variation occurs when the same blood specimen presents different results each time it is measured. This can occur for several reasons, such as precision errors within the hardware, or operator error. For example, in August 2019, tests shows that in a single blood specimen, haemoglobin was reported as anywhere between 98 to 106 dL/g in different machines across the country.
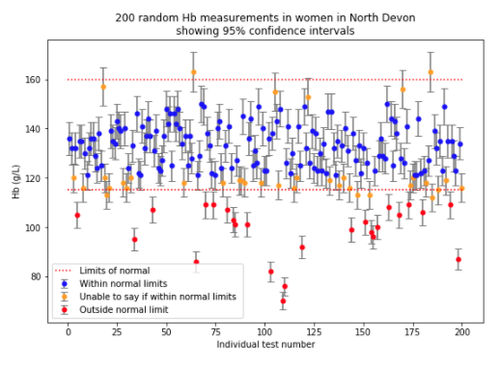
Taking all this into account, there is a considerable amount of uncertainty in any given measurement, and they should be treated with caution.
One way we’ve found of visualising this uncertainty is to plot results as points, with bars showing the range of uncertainty. In this chart, any measurement whose uncertainty bars overlap the red dotted lines cannot be confidently said to be within or outside reference ranges; these are coloured orange, and account for 18% of all measurements in this sample.
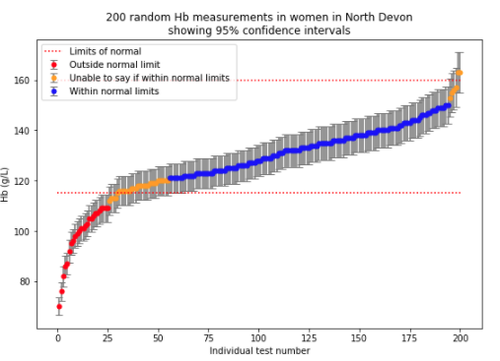
The distribution of test results with a 95% certainty is clearer if you sort the results:
In the next blog we discuss some of the implications of comparing these uncertain values to reference ranges.
More in OpenPathology


Bennett Institute – What We Did Last Year!
5 Feb, 2020
OpenPathology: Issues with reference ranges — Part 3
25 Oct, 2019
OpenPathology: Issues with reference ranges — Part 2
24 Oct, 2019
OpenPathology: fake seasonality in potassium results — dangerous and avoidable
14 Oct, 2019