OpenPathology: getting population sizes right
-
Authors:
Tom Lewis
-
Posted:
- Categories:

At OpenPathology, we’ve already found interesting variation in test request rates between practices, but we’d also like to compare whole laboratories.
The number of tests per patient is an important measure for understanding variation in test requesting across the country. For example, the Getting It Right First Time (GIRFT) initiative uses this measurement to shine a light on clinically important variation and promote improvements in cost-effective care.
For GIRFT, laboratories in England were asked to provide an estimate of their primary care populations. North Devon reported this as 160,000 patients, and Cornwall reported 473,637.
Below, we reproduce the GIRFT report for potassium (a common test, and part of a renal profile). Cornwall is the large blue dot, and North Devon the large yellow dot. The data shows tests performed over one financial year.
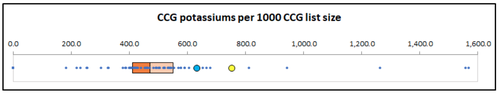
According to this, both North Devon GPs and Cornwall GPs request potassium tests at high rates compared with the national picture; but the North Devon rate is much higher than the Cornwall rate. But what if the denominator data is wrong?
OpenPathology
OpenPathology.net is a new approach for comparing variation in request rates and results. It is modelled on the highly successful OpenPrescribing platform and made by the same team. We have started comparing variation in three ways: between practices; between their CCGs; and between the laboratories that serve the practices.
Laboratories are sending us anonymised data on all the tests they have performed over several years. Whereas GIRFT uses population estimates provided by each lab, which may vary in methodology, OpenPathology calculates populations directly for each practice, using up-to-date list size data from NHS Digital. Importantly, we calculate list sizes after filtering for those practices carrying out non-trivial volumes of testing at each lab.
The following graph compares the mean practice requesting rate since 2014 for North Devon and Cornwall, with 95% confidence limits. It shows that when actual practice list sizes are used in the denominator, potassium requesting rates between the two areas are almost identical.
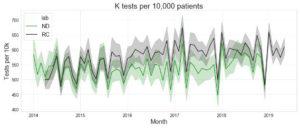
Mean practice request rates for North Devon (ND) and Royal Cornwall (RC) hospitals. Coloured bands show 95% confidence intervals.
It turns out that the true combined list size for North Devon is larger than reported, and that of Cornwall is smaller. Redrawing the GIRFT chart with the correct denominators gives a completely different picture; we would now say that potassium requesting is very similar between the two regions.

Why are the reported list sizes inaccurate?
We have explored why this may be the case for North Devon and Cornwall. Both laboratories obtained their list size from their hospital analytic departments. These departments used the combined list sizes of all practices who have clinical contracts with the hospital. It is very important to note that this is not necessarily coincident with the practices who have testing contracts with the laboratory.
In the case of Cornwall and North Devon, there are two practices on the border who use Cornwall for clinical services but North Devon for laboratory services (giving us novel opportunities for interesting research, of which more later). If we take this into account, then the North Devon laboratory population should be about 20,000 patients larger than reported, whilst the Cornwall laboratory population should be about 20,000 patients smaller.
Conclusions
It is hard to keep track of changes in relationships between practice and laboratories. This is likely to be increasingly true as laboratories undergo significant reorganisation and consolidation of services. The best approach to list size denominators is to always derive them from individual practice data.
Perhaps more importantly, this illustrates the relevance of collaborative, open, interdisciplinary working of the kind we carry out at the Bennett Institute. As anyone who has made an error in a spreadsheet formula knows, it’s very easy for simple mistakes to be propagated from data right through to decision makers. The fact that our team includes specialists from across the spectrum, including a GIRFT clinical lead for pathology (Tom Lewis), means we were quickly able to identify and analyse this problem.
What next?
Having established that we’re confident about our combined list sizes, our next blog post looks at variation at a CCG level, and sense checks it against known changes in clinical practices.
More in OpenPathology


Bennett Institute – What We Did Last Year!
5 Feb, 2020
OpenPathology: Issues with reference ranges — Part 3
25 Oct, 2019
OpenPathology: Issues with reference ranges — Part 2
24 Oct, 2019
OpenPathology: Issues with reference ranges — Part 1
23 Oct, 2019